Declining income expectations helped to push farmer sentiment down again in September as the Purdue University-CME Group Ag Economy Barometer Index fell 12 points to 88. Both of the barometer’s sub-indices, the Index of Current Conditions and the Index of Future Expectations, declined as well. The Current Conditions Index fell 7 points to 76, and the Future Expectations Index dropped 14 points to 94. These were the weakest barometer and future expectations readings since March 2016, when the farm economy was in the throes of an economic downturn. The current conditions assessment very nearly matched that of April 2020, when COVID concerns were top of mind for U.S. farmers. Weak output prices combined with high input costs were key problems cited by survey respondents in September. The September survey took place from September 9-13, 2024.
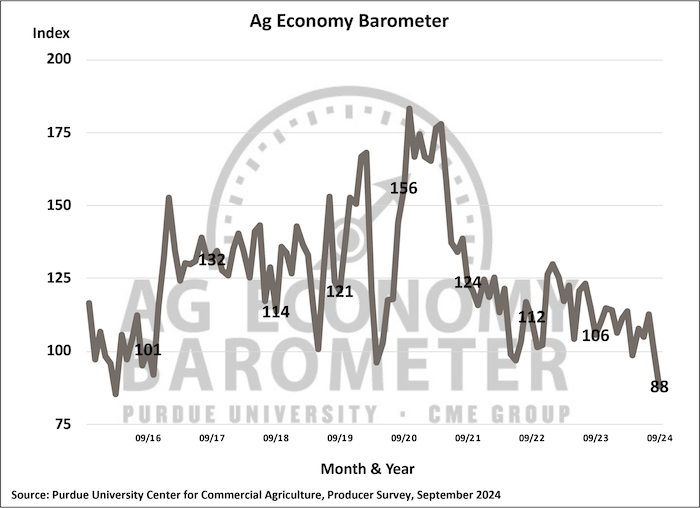
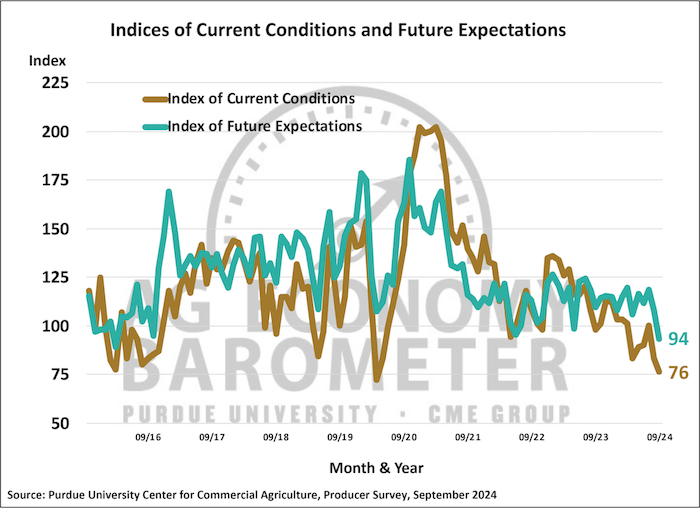
Figure 2. Indices of Current Conditions and Future Expectations, October 2015-September 2024.
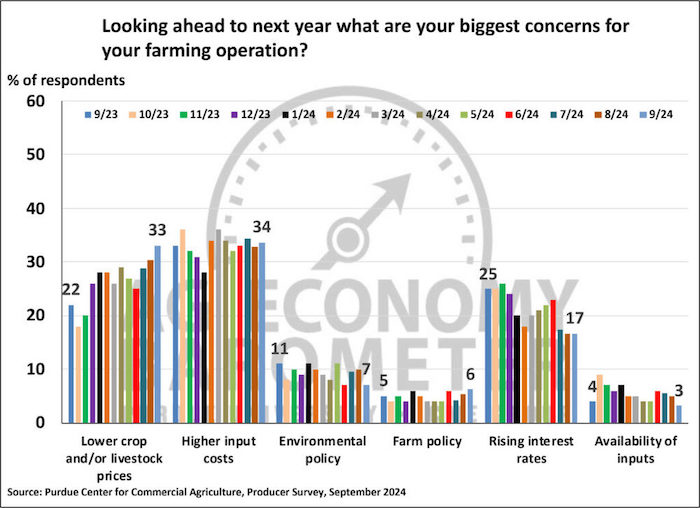
Farmers are concerned about commodity prices, input costs, the future of agricultural trade and how the upcoming election could affect their farm operations. When asked specifically about their biggest concerns for the upcoming year, low commodity prices and high input costs were locked in a virtual dead heat in September as the top 2 concerns for the upcoming year. Thirty-four percent of farmers in the survey chose input prices as a top concern, while 33% chose lower output prices as their biggest concern. Trailing output and input prices as a key concern among producers was interest rates, selected by 17% of respondents. Producers’ concerns about commodity prices was backed up by their lack of confidence in the future of U.S. agricultural exports. This month, just 26% of respondents reported that they expect U.S. agricultural exports to rise over the next five years. Dating back to 2019, when this question was first posed, this was the least optimistic perspective offered by farmers regarding agricultural exports in a barometer survey. In a related question, 78% of producers in this month’s survey also said they are concerned that following the fall 2024 elections, there will be government policy changes that affect their farms.
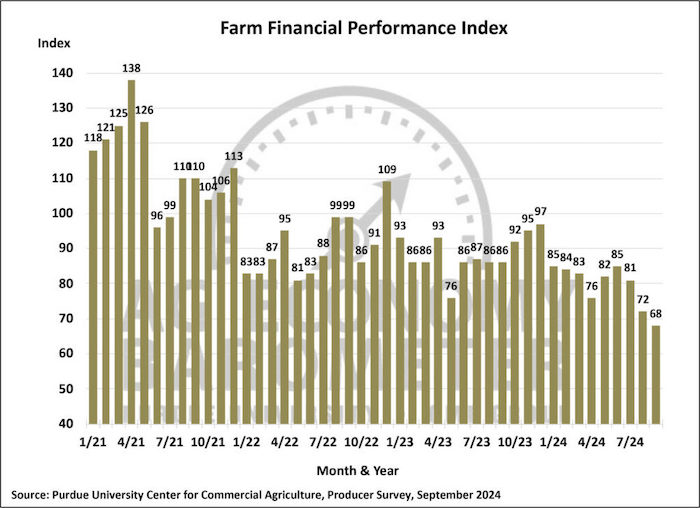
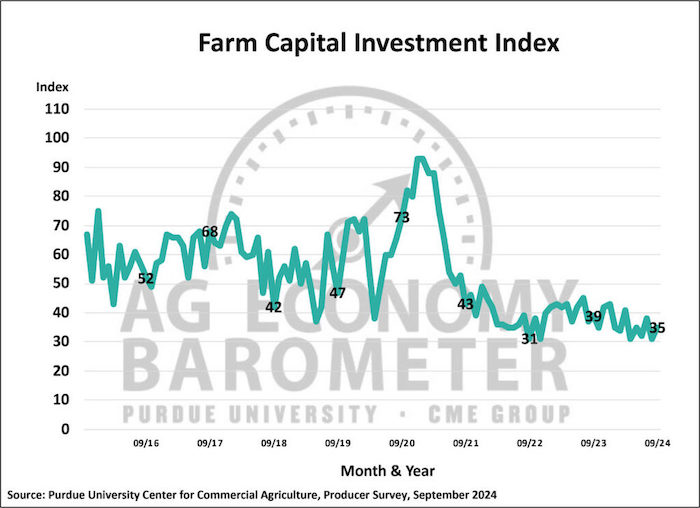
The Farm Financial Performance Index declined for the third month in a row, dipping to 68 in September, down from 72 in August. Farmers’s financial expectations are markedly weaker than a year ago at this time as the index in September 2023 stood at 86, 18 points higher than this month. Although this month’s Farm Capital Investment Index rose 4 points compared to August, the index at 35 remains in very weak territory as a large majority of producers continue to view this as a poor time to make sizable investments.
The Short-Term Farmland Value Index declined 10 points to a reading of 95. The fact that the index dipped below 100 signifies that for the first time since 2020, more farmers said they expect farmland values to weaken in the year ahead than expect values to rise. This month’s shift from a positive to a weaker outlook was attributable to a sharp drop in the percentage of producers who expect values to rise and a concomitant increase among those who expect values to simply hold steady. Unlike the short-term index, the Long-Term Farmland Values Index remained positive in September, rising to 147, 5 points higher than in August.
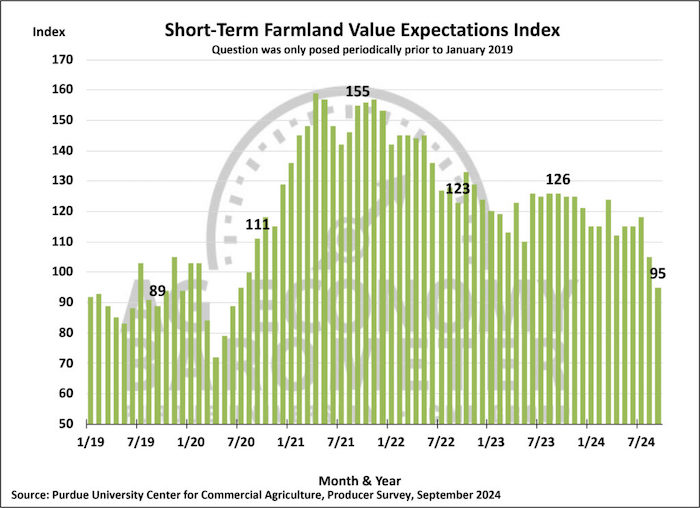
Figure 6. Short-Term Farmland Value Expectations Index, January 2018-September 2024.
The September survey marked the fourth year in a row that the barometer survey has included several questions focused on cover crop usage among corn and soybean producers. Consistent with prior year’s surveys, over half of respondents reported that they currently plant cover crops on part of their farm, and one in five respondents said they had planted cover crops in the past. Among farmers who reported that they currently plant cover crops, the proportion of their farm’s acreage devoted to cover crops has been rising. In 2021, 41% of cover crop users said they planted cover crops on more than 25% of their crop acreage. By 2023, that percentage had increased to 50%, and in this year’s survey, 68% of cover crop users reported planting cover crops on more than one-fourth of their farms’ acreage.
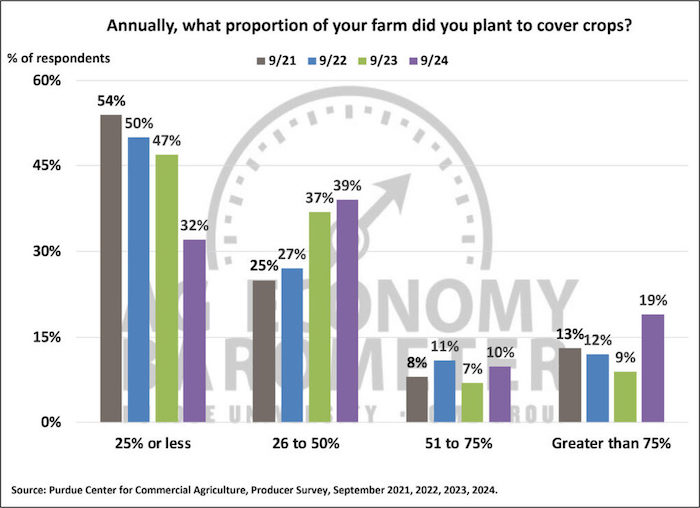
Figure 7. Proportion of Your Farm Planted to Cover Crops, September 2021-September 2024.
Wrapping Up
Concerns about low commodity prices coupled with high input costs leading to poor financial performance expectations weakened farmer sentiment for the second month in a row. This month’s sentiment decline pushed the Ag Economy Barometer index below 100, indicating farmer sentiment is lower than during the barometer’s base period of late 2015-early 2016 when farm incomes were very weak. Producers expect markedly worse financial performance for their farms in the upcoming year compared to their expectations at this time last year. Weak farm income expectations combined with lingering interest rate concerns and a pessimistic agricultural export outlook helped push the Short-Term Farmland Value Expectations Index below 100 for the first time since 2020.